Information visualization seems to be a growing trend in today's knowledge driven, and information-overloaded society. The following represents a URL tree graph of the Security Mind Streams blog -- looks resourceful! Want to freely graph your site/blog? Take advantage of Texone's tree, just make sure you don't forget to press the ESC key at a certain point.
In my first post related to "Visialization, intelligence and the Starlight project" I introduced you a fully realistic and feasible solution to filtering important indicators whatever the reason. Moreover, I also came across a great visualization of malware activity in another post summarizing malware trends around February. What I'm truly enjoying, is the research efforts put in the concept by both, security/IT professionals, and new media companies realizing that the current state of the mature text-based Web.
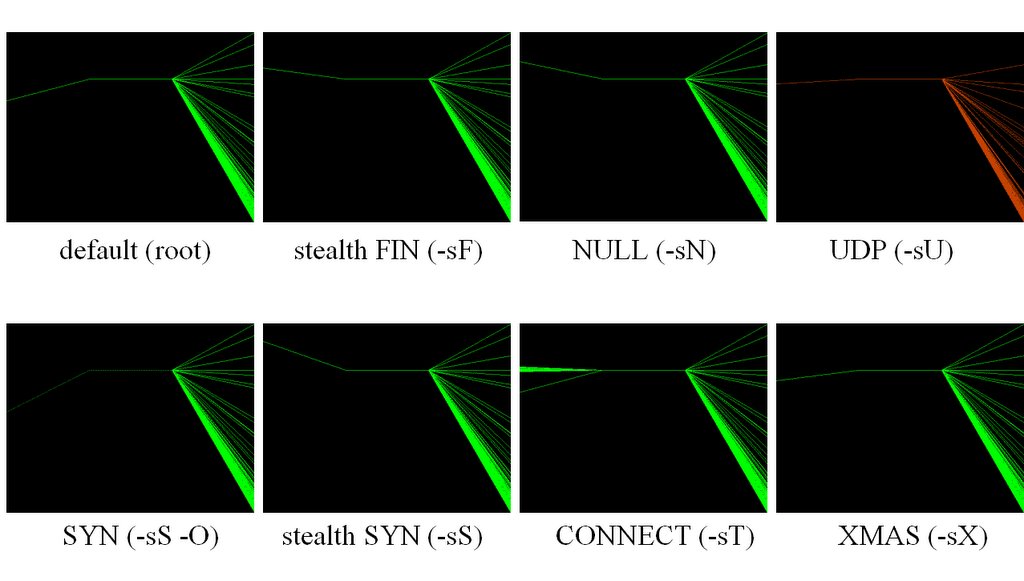
Ever wanted to see how noisy connect() scans actually are? In early stage of its development, people are already experimenting with the idea, find more about while going through "Passive Visual Fingerprinting of Network Attack Tools" paper.
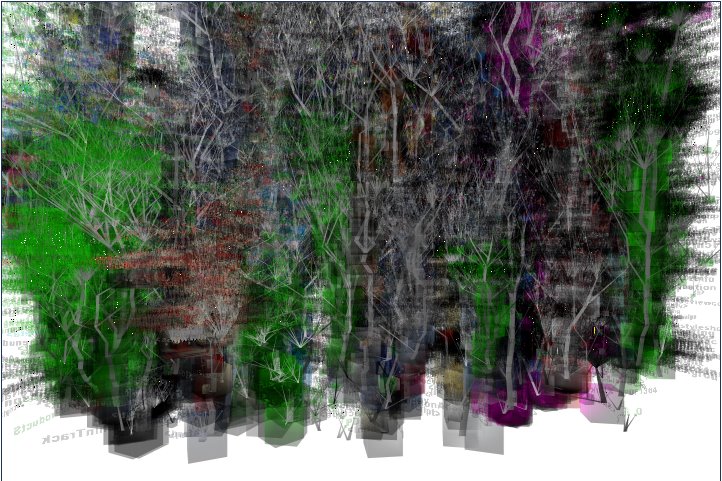
Things are getting much more quantitative and in-depth in another recommended reading on the topic "Real-Time Visualization of Network Attacks on High-Speed Links" whose purpose is to "show that malicious traffic flows such as denial-of-service attacks and various scanning activities can be visualized in an intuitive manner. A simple but novel idea of plotting a packet using its source IP address, destination IP address, and the destination port in a 3-dimensional space graphically reveals ongoing attacks. Leveraging this property, combined with the fact that only three header fields per each packet need to be examined, a fast attack detection and classification algorithm can be devised."
Presented at this year's BlackHat con "Malware Cinema, a Picture is Worth a Thousand Packets" will provide with much more fancy visualization concepts related to malware. Originally presented by Gregory Conti, you can also download the associated resources, and keep an eye on the audio in case you didn't attend the con.
As far as new media is concerned, I'm so impatient to witness more developments given how boring I find any of the browsers I've used so far -- and there're a lot of developments going on as always! Virtual worlds have the potential to change the face of the Web, the text/image based one the way we know it.
Remember how the federal agents were chatting face-in-face with the malicious attacker through the innovative and programmed for the masses browser, in NetForce? Hive7 is the alternative in 2006, and if you spend some with it, you'll be impressed by its potential -- say goodbye to the good old IRC?
UPDATE : LinuxSecurity.com picked up the post "Visualization in the Security and New Media world"
More resources can also be found at :
CAIDA Visualization Tools
NAV - Network Analysis Visualization
Digital Genome Mapping - Advanced Binary Malware Analysis
A Visualization Methodology for Characterization of Network Scans
NVisionIP : An Interactive Network Flow Visualization Tool for Security
Exploring Three-dimensional Visualization of Intrusion Detection Alerts and Network Statistics
Attacking Information Visualization System Usability Overloading and Deceiving the Human
Security Event Visualization and Analysis - courtesy of CoreLabs
A Visualization Paradigm for Network Intrusion Detection
FireViz: A Personal Firewall Visualizing Tool - the FireViz project
Technorati tags:
Security, Information Security, Monitoring, Visualization, Network, New Media
Showing posts with label Visual Information System. Show all posts
Showing posts with label Visual Information System. Show all posts
Friday, March 31, 2006
Visualization in the Security and New Media world
 Independent Security Consultancy, Threat Intelligence Analysis (OSINT/Cyber Counter Intelligence) and Competitive Intelligence research on demand. Insightful, unbiased, and client-tailored assessments, neatly communicated in the form of interactive reports - because anticipating the emerging threatscape is what shapes the big picture at the end of the day. Approach me at dancho.danchev@hush.com
Monday, January 23, 2006
Visualization, Intelligence and the Starlight project
 Today, I came across a stunning collection of complex networks visualizations, that reminded of how we must first learn to visualize and than go deeper into VR. Until, I first visited this project, the Atlas of Cyberspace
was perhaps my favorite visualization resource, rather outdated, still
has a lot to show.
Today, I came across a stunning collection of complex networks visualizations, that reminded of how we must first learn to visualize and than go deeper into VR. Until, I first visited this project, the Atlas of Cyberspace
was perhaps my favorite visualization resource, rather outdated, still
has a lot to show.
Visualization is important for today's greatly
developed knowledge networks, data mining, and even information security
or basic network management issues. But at the bottom line, who always
has the best toys, or at least develops them? The academic world? Sort
of, except that they need the private sector to go public, so that
leaves the U.S military in my point of view :) and they sure do.

The Starlight - Information Visualization Technology is simply a remarkable concept that these folks actually turned into a reality. It uses both structured, unstructured, spatial and multimedia data and provides real-time output, and if you also consider that the project is reportedly down several years ago, for me it opens up the question, who's the successor?
 It's national security applications and the syndication of data sources are so clearly visible, that reducing paper-work, platform dependence, information sharing, and perhaps not another Able Danger scenario(if one actually happened!) is the biggest advantage of such a project.
Going back to the "reality"(yeah sure!), in case you've never seen ChicagoCrimes, the free database of crimes reported in Chicago, it's yet another great initiative that again visualizes based on reports and Google Maps, and you don't need a security clearance to use it :) What's else to mention, is CNET's introduction of "The Big Picture" in cooperation with Liveplasma.com of course, clearly, the waves of information flow must be somehow filtered and there's a clear, both, commercial, public and intelligence need for it. Even VR investments are actively taking place, a lot's to come for sure!
Some concepts and clips on visualization :
TouchGraph Google Browser
Real-Time and Forensic Network Data Analysis Using Animated and Coordinated Visualization
F-Secure's visualization of the 1st PC virus, and W32.Bagle, and you can actually see the clip itself.
Visualization study the U.S - clip
Technoratai tags :
security,information security,intelligence,OSINT,starlight,visualization,virtual reality
Independent Security Consultancy, Threat Intelligence Analysis (OSINT/Cyber Counter Intelligence) and Competitive Intelligence research on demand. Insightful, unbiased, and client-tailored assessments, neatly communicated in the form of interactive reports - because anticipating the emerging threatscape is what shapes the big picture at the end of the day. Approach me at dancho.danchev@hush.com
Subscribe to:
Posts (Atom)